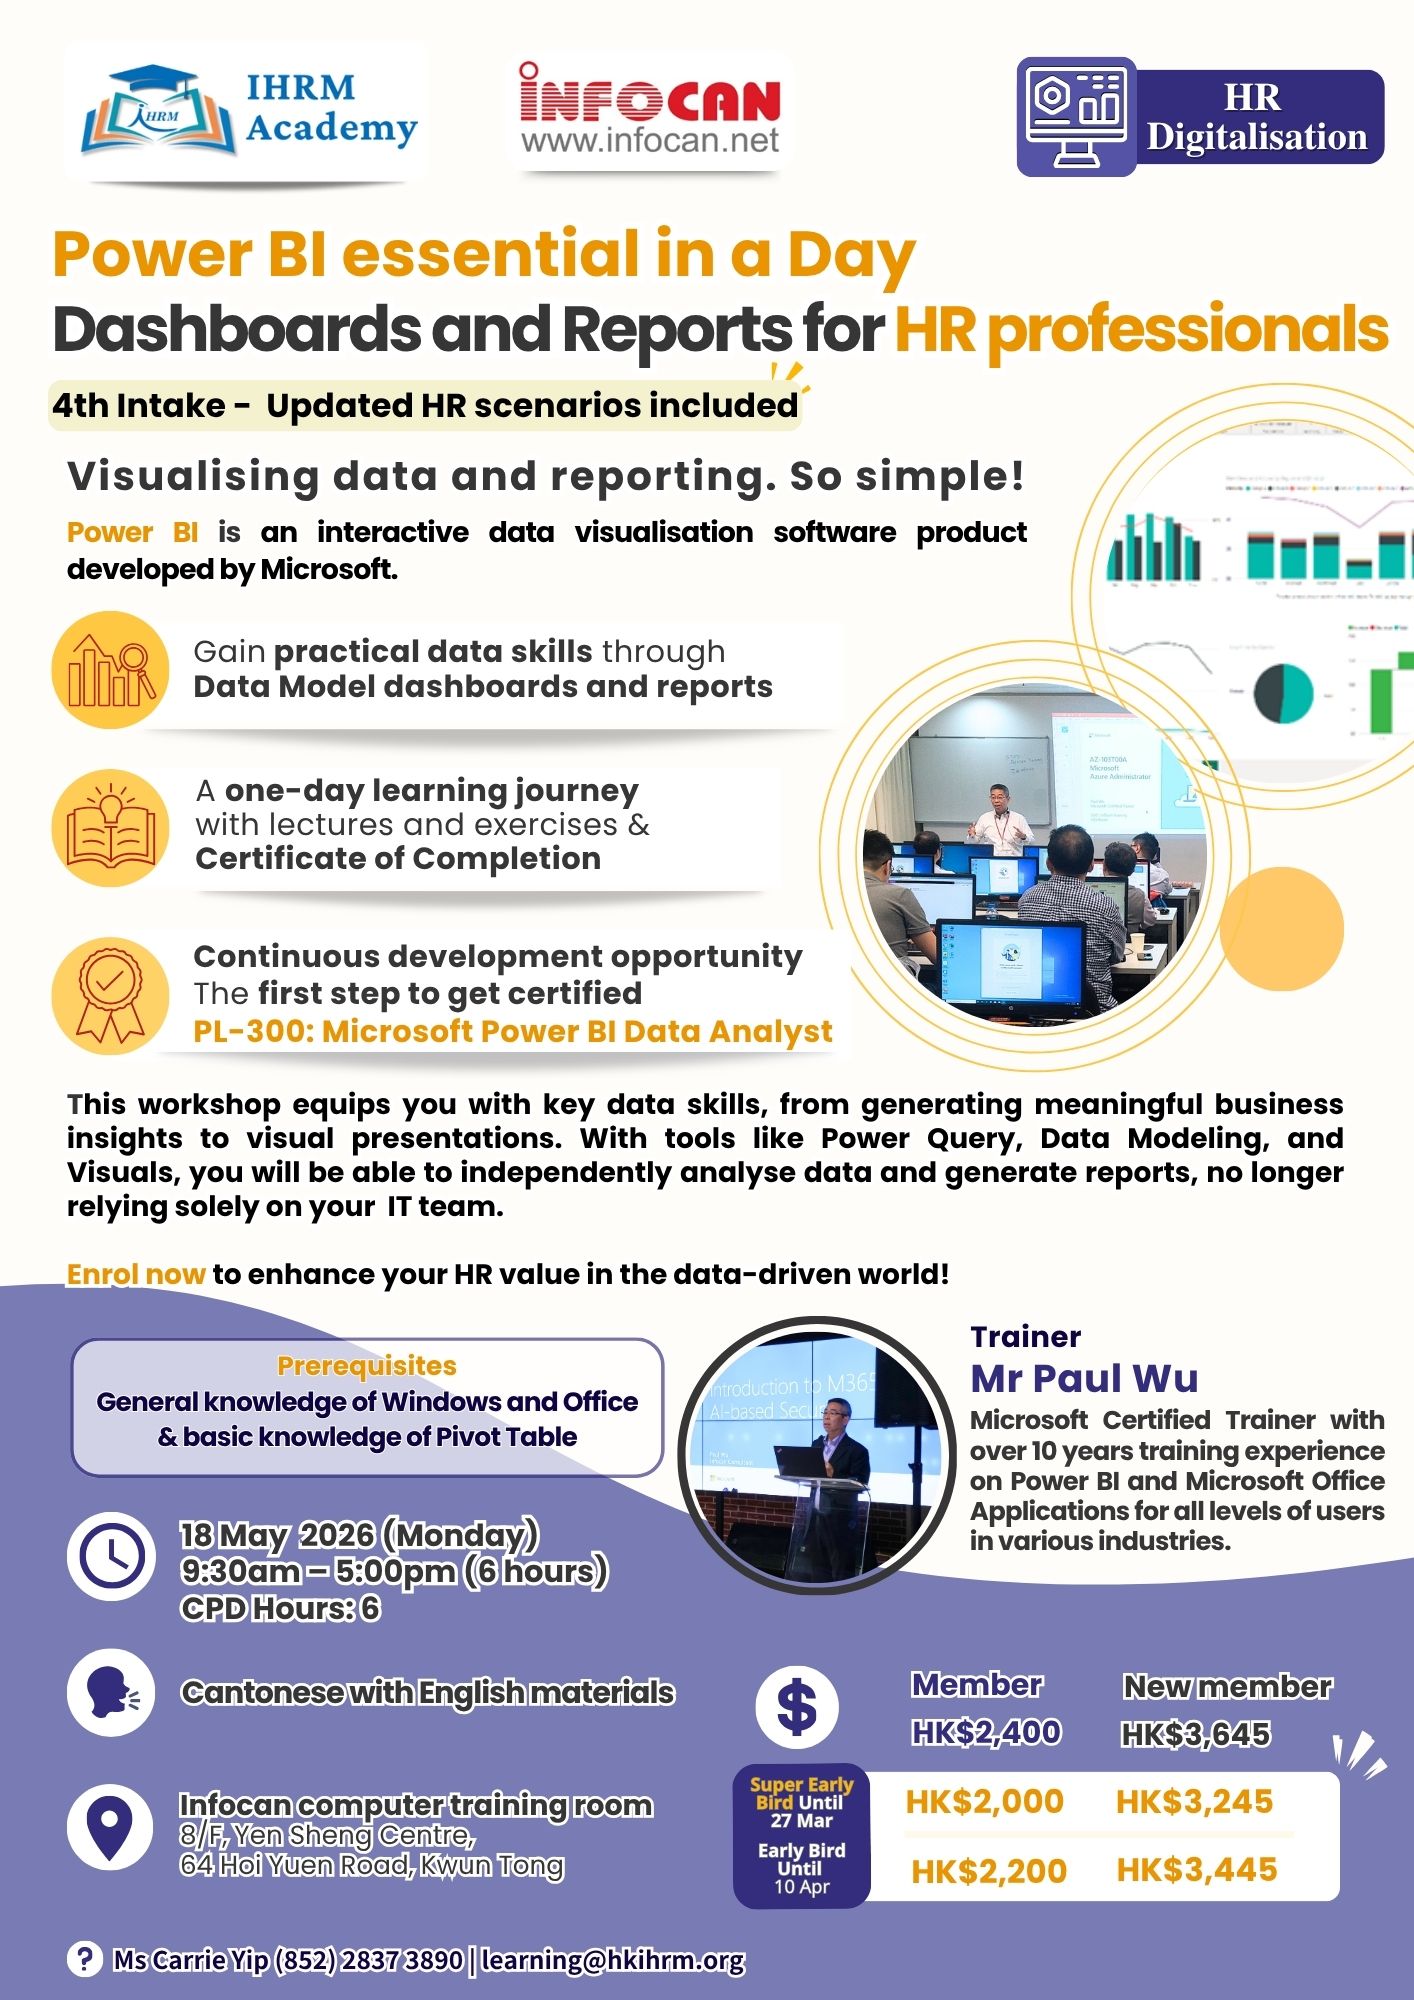
Power BI is an interactive data visualisation software product developed by Microsoft.
This workshop equips you with key data skills, from generating meaningful business
insights to visual presentations. With tools like Power Query, Data Modeling, and
Visuals, you will be able to independently analyse data and generate reports, no longer
relying solely on your IT team.
Enrol now to enhance your HR value in the data-driven world!
Prerequisites
General knowledge of Windows and Office & basic knowledge of Pivot Table
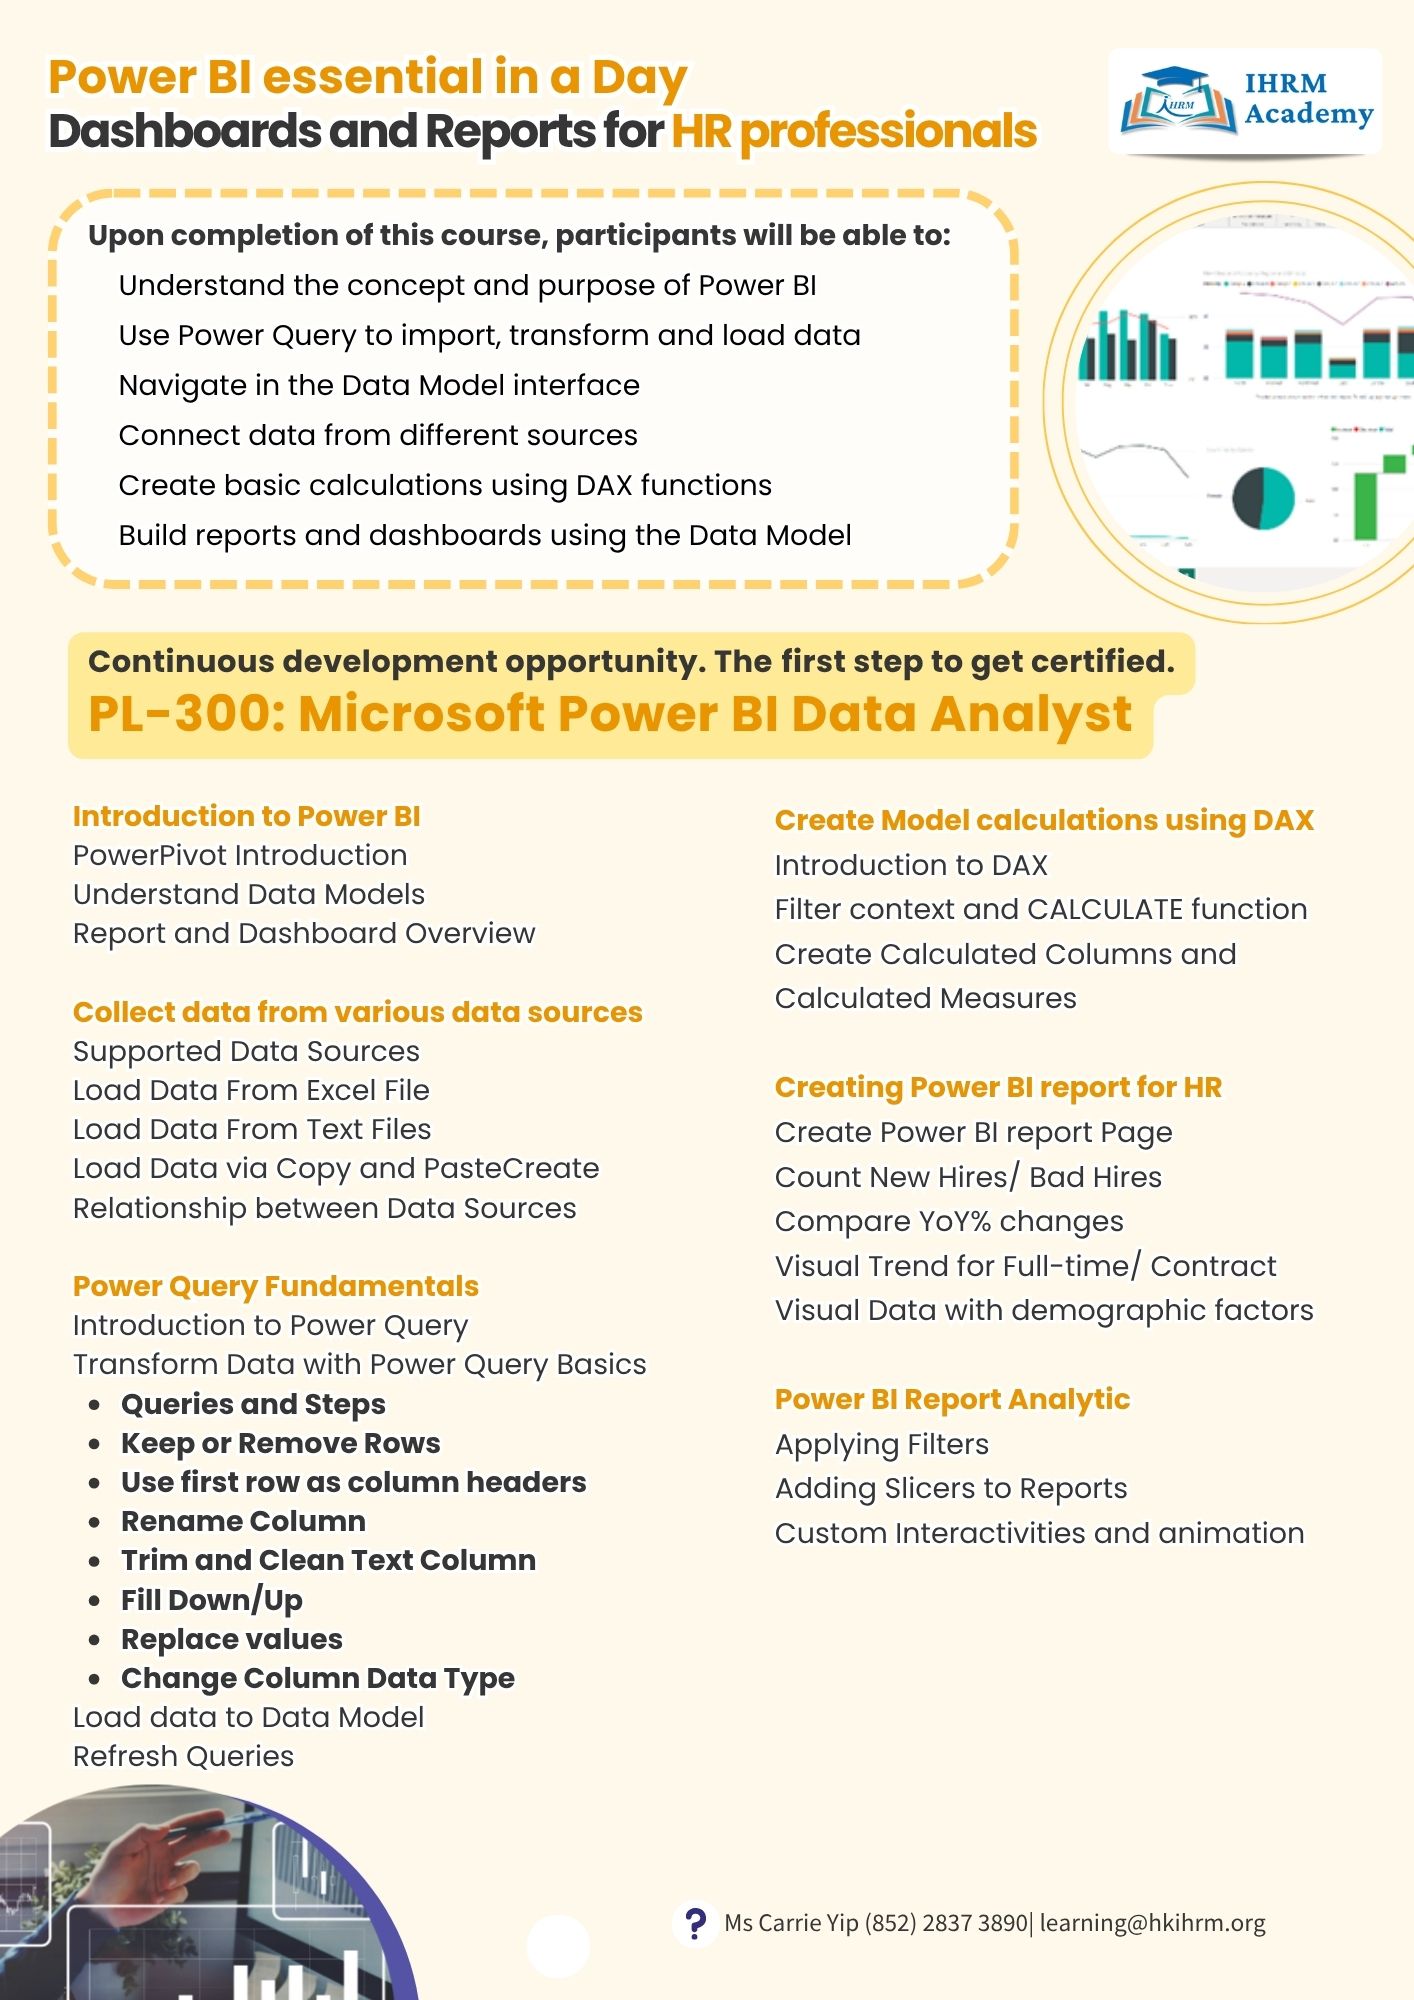
Upon completion of this course, participants will be able to:
- Understand the concept and purpose of Power BI
- Use Power Query to import, transform and load data
- Navigate in the Data Model interface
- Connect data from different sources
- Create basic calculations using DAX functions
- Build reports and dashboards using the Data Model
Introduction to Power BI
PowerPivot Introduction
Understand Data Models
Report and Dashboard Overview
Collect data from various data sources
Supported Data Sources
Load Data From Excel File
Load Data From Text Files
Load Data via Copy and PasteCreate
Relationship between Data Sources
Power Query Fundamentals
Introduction to Power Query
Transform Data with Power Query Basics
- Queries and Steps
- Keep or Remove Rows
Use first row as column headers - Rename Column
- Trim and Clean Text Column
- Fill Down/Up
- Replace values
- Change Column Data Type
- Load data to Data Model
- Refresh Queries
- Create Model calculations using DAX
Introduction to DAX
Filter context and CALCULATE function
Create Calculated Columns and
Calculated Measures
Creating Power BI report for HR
Create Power BI report Page
Count New Hires/ Bad Hires
Compare YoY% changes
Visual Trend for Full-time/ Contract
Visual Data with demographic factors
Power BI Report Analytic
Applying Filters
Adding Slicers to Reports
Custom Interactivities and animation